X
By Topic
Abstract:
Fast load impedance tuning of a varactor diode matching network to maximize amplifier gain in real-time reconfigurable circuitry is demonstrated. A published tunable varactor-diode matching topology is designed for operation at 1.3 GHz to provide significant Smith Chart coverage. A steepest-ascent algorithm is applied for fast optimization, and measurement results indicate excellent convergence from multiple starting points within the Smith Chart. Algorithm data compares well with traditional loadpull results measured with both a commercially available tuner and the tunable-varactor network, and searching with the varactor tuner search is much faster than a traditional mechanical tuner.
Date of Conference: 15-18 Jan. 2017
Date Added to IEEE Xplore: 27 March 2017
ISBN Information:
Electronic ISSN: 2164-2974
Publisher: IEEE

SECTION I.

Introduction

Reconfigurable matching circuitry is needed in cognitive and adaptive wireless transmitters for real-time changes in operating frequency and system performance requirements. We designed a 1.3 GHz matching network using the approach of Fu [1] and used this to perform fast tuning of a field-effect transistor (FET), optimizing gain using a fast steepest-ascent algorithm. Nemati has demonstrated design of varactor-based tunable matching networks for dynamic load modulation [2]. Qiao [3] and du Plessis [4] have reported real-time impedance matching using genetic algorithms, which tend to be inherently slow for many impedance matching problems. We have previously demonstrated optimization of load impedance to maximize output power [5]. This previous application of algorithms, however, is idealized in many ways. In this paper, we implement the fast load-pull search to maximize transducer gain     using a prototype tunable-varactor circuit for use in real-time reconfigurable transmission.

SECTION II.

Tunable Matching Network Design and Challenges

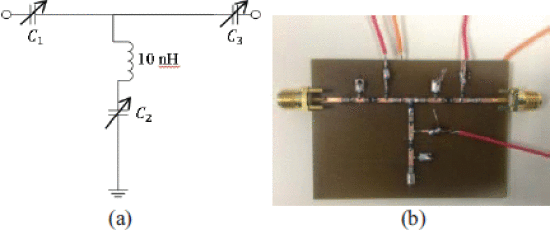
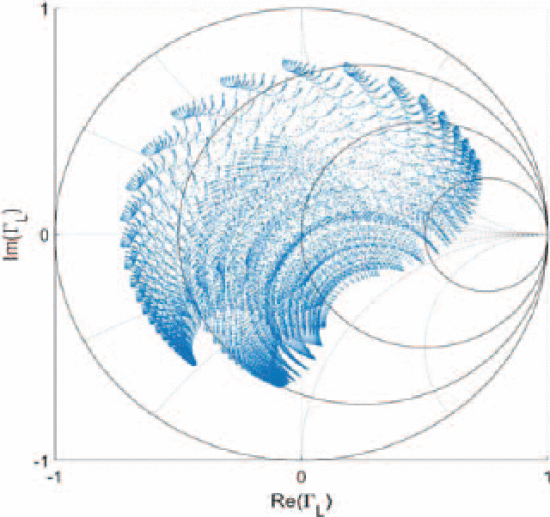
We designed a tunable-varactor matching network based on the method of Fu [1] at 1.3 GHz (Fig. 1(a)). The circuit was fabricated on a 59-mil FR4 substrate (Fig. 1(b)) and characterized at 0 dBm input power using S-parameter measurements (Fig. 2). The characterized range of the tuner covers much of the Smith Chart.

Figure 1
Fig. 1.

(a) Design of 1.3 GHz tunable matching network, based on Fu [1], (b) Implemented tunable-varactor matching network

Figure 2
Fig. 2.

Characterized load reflection coefficient states for the tunable varactor matching network

Figure 3
Fig. 3.

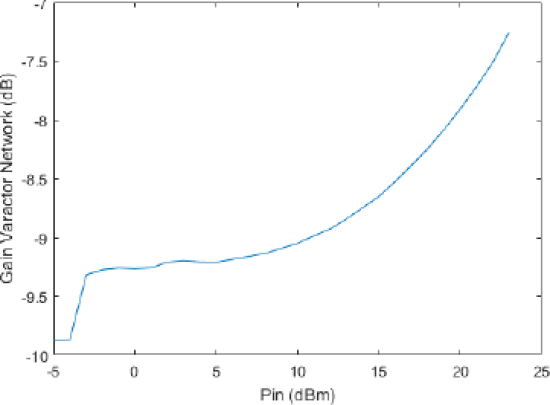
Measured     versus input power for the varactor matching network at           .

The tuner was also tested for nonlinear behavior. Significant variations in the S-parameters with increasing input power are observed. Figure 3 shows that at           , the matching network     varies approximately 2.5 dB over input power variation from −5 dBm to +23 dBm. Additional testing over different varactor bias conditions for      , and     shows that variations are most significant for large values of the varactor bias voltages. As such, accurate characterization of     is needed near the value of power expected to be input to the matching network. Because the purpose of the present paper is to demonstrate the feasibility of fast tuning using a tunable-varactor matching network, a low power value is used to avoid these nonlinearities.

SECTION III.

Algorithm Adaptation for Varactor Network

Our previous gradient search optimization [5] was modified and implemented with the tunable-varactor network to maximize    . A plane can be fit to the     surface near the candidate     representing the change in     from the candidate as a function of        :

            
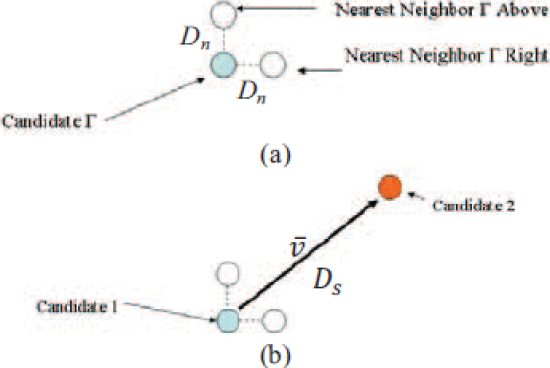
View SourceRight-click on figure for MathML and additional features. where   and   are real coefficients that must be found. It is desired (Fig. 4(a)) to estimate the gradient using measurements of     at the neighboring points     and (0,    ) with respect to the candidate    . If these are not available from the characterization, measurement should be performed at characterized nearby points       and      , due to the difficulty of accurate interpolation with the varactor tuners. If     and     are the measured     values relative to the candidate at these points, this gives two equations,
                   
View SourceRight-click on figure for MathML and additional features.
that can be solved simultaneously for   and  . The gradient of this surface     is calculated as follows:
                
View SourceRight-click on figure for MathML and additional features.
and the search vector in the direction of steepest ascent is
                    
View SourceRight-click on figure for MathML and additional features.
as shown in Fig. 4(b). The rest of the algorithm proceeds similarly to our standard-tuner method [5]. The search distance     is divided by a factor of 2 if the next candidate provides a lower     value. The search selects the best measured point as the optimum when     becomes less than the prespecified resolution distance    .

Figure 4
Fig. 4.

(a) Estimation of gradient by     measurements of nearby points separated by neighboring-point distance    . (b) Jump to the next candidate point in the direction of steepest ascent by search distance     (reprinted from [5] for convenience).

SECTION IV.

Measurement Results

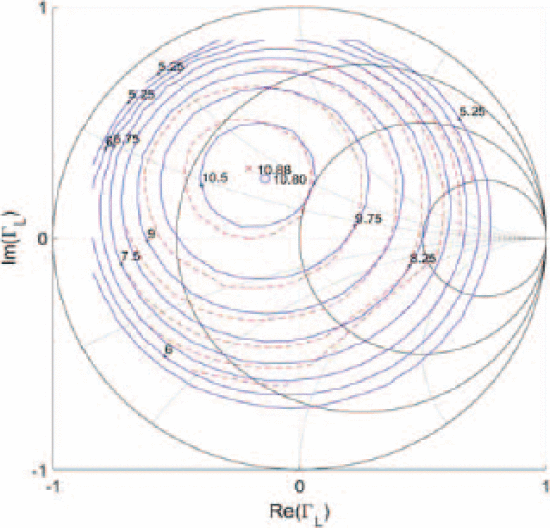
The algorithm was measurement tested using a Microwave Technologies MWT-173 FET, with single-tone input power of −20 dBm at 1.3 GHz. The small input power value was used to ensure the varactor network is operated in its linear region. Custom load-pull software was implemented for matching and fixture network characterization and correction, as well as communication with instrumentation. Figure 5 shows the −20 dBm loadpull characteristics as measured by the varactor tuner, compared with contours measured by a standard Maury Microwave tuner. The optimum     and     values are nearly identical for the varactor and Maury tuners.

Figure 5
Fig. 5.

1.3 GHz single-tone MWT-173 FET load-pull transducer gain     contours measured using the tunable-varactor matching network (dashed curves, optimum     at            ) and Maury load-pull tuner (solid curves, optimum     at            ) for −20 dBm input power.

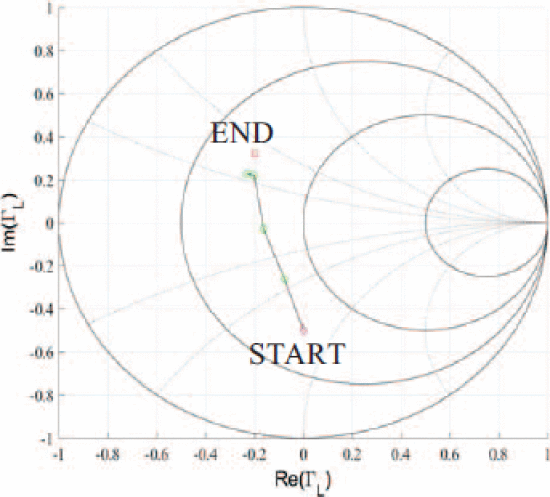
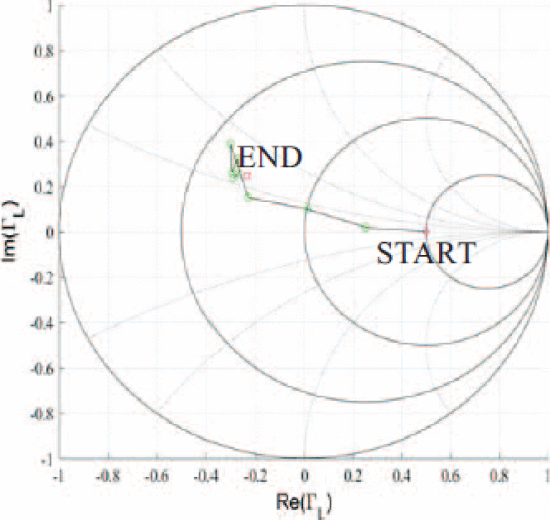
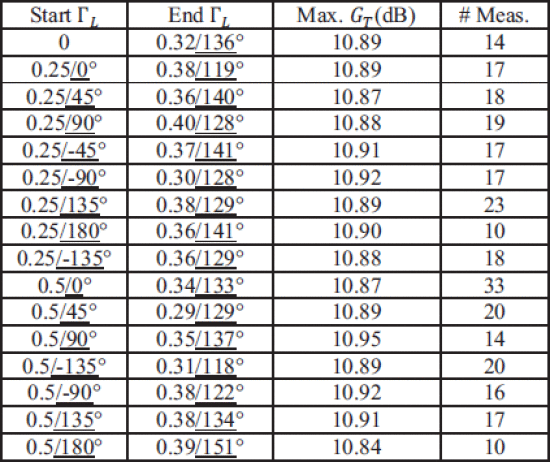
Figures 6 and 7 show two algorithm searches taken from different starting values of     within the operating region of the matching network. Table I shows excellent agreement of the search end     and maximum     values for algorithm search results from 16 different starting     values. The results also correspond well with traditional load-pull from varactor and Maury tuners.

Even for bench-top testing with significant equipment overhead, searching with the varactor tuner is much faster than with the Maury tuner. An algorithm run from     required 1 minute, 15 seconds using the varactor tuner, compared to 5 minutes, 38 seconds using the Maury tuner.

Figure 6
Fig. 6.

Fast load-impedance optimization for output power fromstarting location              . A maximum     was obtained at       with 16 experimental queries.

Figure 7
Fig. 7.

Fast load-impedance optimization for output power from starting location          . A maximum     was obtained at             with 33 experimental queries.

SECTION V.

Conclusions

A fast real-time load-impedance search algorithm has been demonstrated on a tunable-varactor matching network. The tunable-varactor network provides repeatable results from multiple starting reflection coefficients with a small number of measurements, comparing well with traditional load-pull measurements, but allowing fast, real-time reconfiguration. Results show excellent correspondence for different starting load reflection coefficient values, and compare well with traditionally measured load-pull results. This algorithm is expected to be useful for implementation in cognitive communication and radar systems, allowing the matching network to quickly adapt for changing frequency bands and performance requirements. Future work will investigate advanced power-dependent characterization to counteract the effects of matching-network nonlinearities.

Table I: Tunable-varactor matching network algorithm results from multiple starting reflection coefficients
Table I:

ACKNOWLEDGMENT

This work has been funded by the Army Research Laboratory (Grant No. W911NF-16-2-0054) and the National Science Foundation (Grant No. ECCS-1343316). The views and opinions expressed do not necessarily represent the opinions of the U.S. Government.

Authors

Baylor University, Waco, TX 76798, USA
Army Research Laboratory, Adelphi, MD 20783, USA
Baylor University, Waco, TX 76798, USA